Phosphors modeling by simple ray tracing algorithm: CSP design
Optical ray tracing modeling applied Beer-Lambert method in the single luminescence material system to model the while light pattern from blue LED light source. Dr. Yuan has been published a scientific paper to extend this algorithm to a mixed multiple luminescence material system by introducing the equivalent excitation and emission spectrum of individual luminescence materials.
Geometric ray tracing is a method for calculating the path of waves or particles through a system with regions of varying propagation velocity, absorption characteristics, and reflecting surfaces. The Beer-Lambert absorption theory was applied to model the fluorescence mechanism in ray tracing algorithm. By such combination, researchers are able to simulate the white light pattern emitted from blue/UV source.
This paper extends Beer-Lambert method by introducing equivalent luminescence material characteristics, which includes equivalent excitation and emission spectrums. The equivalent spectrums are obtained from the individual luminescence material, by considering the mixing ratio, quantum efficiency and internal light absorption (This is the light emitted from one type of phosphors but absorbed by another one from the same phosphors system).
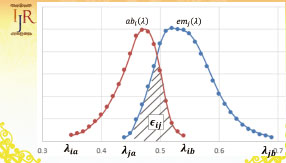
For the multiple luminescence materials system, where the absorption and emission wavelengths are represented by `ab_i(lambda)` and `em_i(lambda)`, respectively. These materials are mixing by `r_i` ( `sum_(i=1)^n(r_i)=1`) with quantum efficiencies of `q_i`, the equivalent luminescence material properties can be computed as: Equivalent Absorption spectrum `ab_(eq)(lambda)=sum_(i=1)^(i=n) (r_i)*ab_i(lambda)` and Equivalent Emission spectrum `em_(eq)(lambda)=sum_(i=1)^(i=n) (k_i^')*em_i(lambda)`, where `k_i^'=[bar epsilon]**{q*r}` is an equivalent ratio, which corrects the inter-absorption of the multiple phosphor system, and make such system to an ideally independent phosphor system (which might not exist in reality).
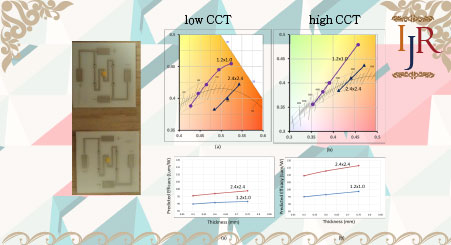
By the comparison of the industrial fabricated CSP and our model, a difference of the 0.0079 (average) was achieved from CIE1931XYZ and efficacy of 10%. The errors are due to the incorrect of the input parameters, such as quantum efficiencies and blue chip spectral (due to binning). Figures show the color temperature and efficacy prediction of mixing ratio of 8:1:1 (green:orange:red), and Figures are the ones of 16:1:1. From Figure, they both shows red-shift of the color points result from the increasing of the CSP x-y dimension, which also indicate the large emission angle of the CSP structure. From the manufacturing point of view, it also indicates the requirement of the precision of the CSP sigulation. Moreover, the result shows that when the green phosphors density is dominated, the thickness color point response under different thickness are more linear. The back-scattering of CSP induced nonlinearity becomes more severe when the densities of orange and red phosphors increases. Accordingly, a slight mis-control of the CSP thickness will induce severe change of the color temperature.
Please watch the introduction presentation: